Understanding the tcptrace Time-Sequence Graph in Wireshark – PacketBomb

Understanding the tcptrace Time-Sequence Graph in Wireshark

By Kary | text

Jun 03

If I’m troubleshooting a performance issue, one of the first tools I reach for in Wireshark is under Statistics > TCP StreamGraph > Time-Sequence Graph (tcptrace). At a glance I can tell if this is going to be an easy one to analyze or if I’m gonna have to roll up my sleeves and dive in deeper.

I’ll be showing you how to use the time sequence graph in my next video, but for now let’s talk about how to interpret the lines and colors and markings.

The Time-Sequence graph shows a data stream over time. By definition, a stream is moving in one direction. So if a client is downloading a file from an FTP server you must click on a packet from the server before generating the graph. Again, it is only showing you data flowing in one direction.

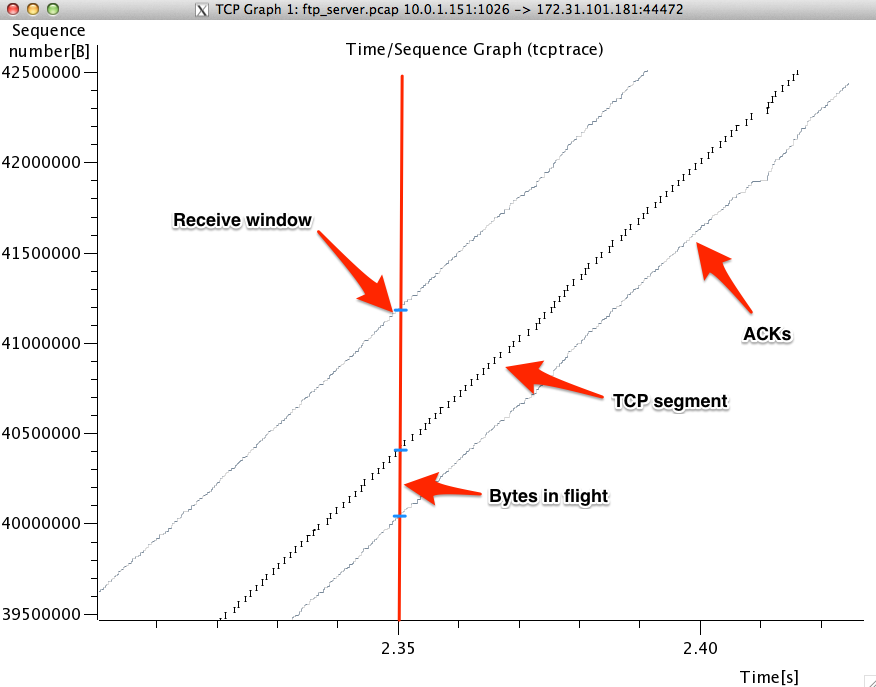
Here’s a zoomed in screencap with some annotations:

tcptrace1

The x-axis is time. So this shows seconds e.g. 2.35 seconds. The y-axis is TCP sequence numbers. Sequence numbers are representative of bytes sent. The sequence number increases by 1 for every 1 byte of TCP data sent. Ideally you’d want to see a smooth line going up and to the right. The slope of the line would be the theoretical bandwidth of the pipe. The steeper the line, the higher the throughput.

The little black I-beams represent TCP data segments. The longer the I-beam, the more data per packet. The gray line below that are the ACKs from the receiver. The distance between the ACKs and the TCP data at a given point in time represents the bytes in flight. So if at 2.35 seconds the server is sending byte 40,400,000 and receives at ACK for 40,000,000, then there are 400,000 unacknowledged bytes in flight. (I added the red line and blue tick marks at 2.35; it’s not part of the graph)

The top line represents the calculated receive window of the client. This is the ACK number plus the current advertised receive window. If the current ACK is 40,000,000 and the advertised receive window is 1,200,000 then the calculated receive window will be at 41,200,000. The distance between the current TCP sequence number (40,400,000) and the calculated receive window (41,200,000) is how much data the client can buffer (800,000).

Ok, that covers the basics. Here’s a few more things:

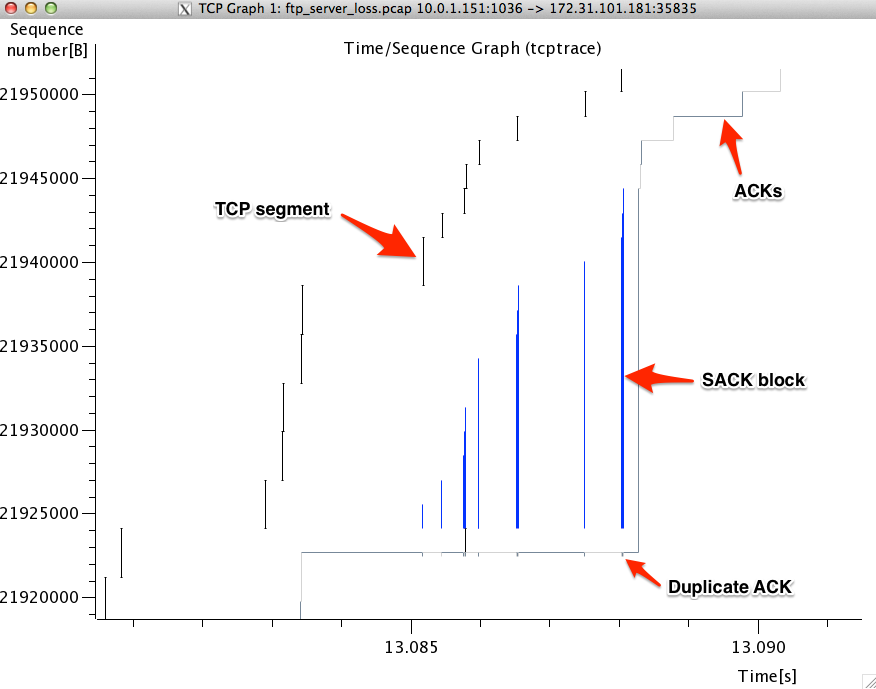
tcptrace2

We still have the TCP segment data and the ACKs represented as before. Now we have two new things in regards to data loss and recovery. Duplicate ACKS are represented as small ticks on the underside of the ACK line. SACK blocks are the blue lines above the tick marks i.e. dup ACKS.

A few quick items to note:

  • You can use the ‘i’ key to zoom in at the current mouse position
  • You can use the ‘o’ key to zoom out from the current mouse position
  • You can right click hold and drag around the graph
  • You can left click hold and drag a rectangle to zoom in on a region
  • You can single left click on a segment or ACK to go to that packet in the pcap (very useful)

I’ll go over this in further detail in the next video. If you’re not sure what advertised receive windows, dup ACKS, or SACK blocks are, no worries, it will all be revealed in good time. Bookmark this page and reference it in the future.

If you have any tips or tricks for the tcptrace Time-Sequence graphs, leave a comment!

If you’d like to see some examples of good and bad time-sequence graphs, subscribe to the newsletter and get access to the additional videos.


Share this post! Spread the packet gospel!

Facebooktwitterredditlinkedinmail
Follow

About the Author

I like being the hero. Being able to drop a bucket of root cause analysis on a burning network problem has made me a hero (to some people) and it feels real good, y’all. Get good at packet analysis and be the hero too. I also like french fries.

Leave a Comment:

(10) comments

Tim June 19, 2014

regarding time sequence graph while I still don’t fully have a grasp on it I would suggest telling folks to change tcp sequence number to relative sequence numbers because (it appears at least) the sequence numbers line up on graph and trace

also, it would help me to see an example of a bad scenario and good scenario

Reply
Kary June 19, 2014

Tim,

That’s a good point. If you want the sequence numbers in the graph to match the sequence numbers in the trace, then enable relative sequence numbers. Though I would argue that that actual sequence number in the graph isn’t all that important.

Future videos will make extensive use of the tcptrace graph and will show good and problematic graphs.

Reply
Fritz June 16, 2015

What version of Wireshark is this…? I have never seen three lines in any version I’ve had.

R/Fritz

Reply
    Kary June 22, 2015

    I believe it was 1.12.x

    Reply
      Fritz August 18, 2015

      Seems like the new version is less capable…

      Thanks…BTW…Great material

      I have a really strange throughput graph…is it possible to upload an image?

      R/Fritz

      Reply
        Fritz August 18, 2015

        Just figured out that I was not zoomed out far enough to distinguish the ACKs from the segments…R/Fritz

        Reply
YS September 20, 2015

Hi Kary

My TCP knowledge is very limited so I’m trying to understand the line when you say “The top line represents the calculated receive window of the client. This is the ACK number plus the current advertised receive window.” Can you elaborate this and isn’t the receiver window calculated from the scale factor in the HS?

thank you for taking your time to share such wonderful knowledge. Please make more ;) these are very helpful for my job.

Reply
    Kary September 27, 2015

    Yes, the receive window is calculated from the scaling factor. However, in the context of this graph, we take that calculated receive window and add the current ACK number to get the receive window line on the graph. This way we get a visual representation of how much space there is in the receive buffer. The more space there is between the data line and receive window line, the more space there is in the buffer.

    Reply
Jamin April 28, 2016

A huge factor in actually seeing the graph correctly will depend on whether you have an inbound or outbound packet selected in the packet window. If you dont see anything try clicking a packet from the other direction in the conversation. Wireshark 2.x has a button called Switch Direction to make this more convenient. They also let you select the stream directly in the TCPTrace window. Very handy stuff. Thanks for the good article, the WCNA book doesnt break this down as well as you did!

Reply

[…] Wireshark’s tcptrace analog showed that bytes in flight were not limited by the receive window size.  This […]

Reply
Add Your Reply

Leave a Comment: